Market snapshot
The global equity market in November posted its third consecutive monthly return of more than 2% and its ninth positive monthly return for 2019:
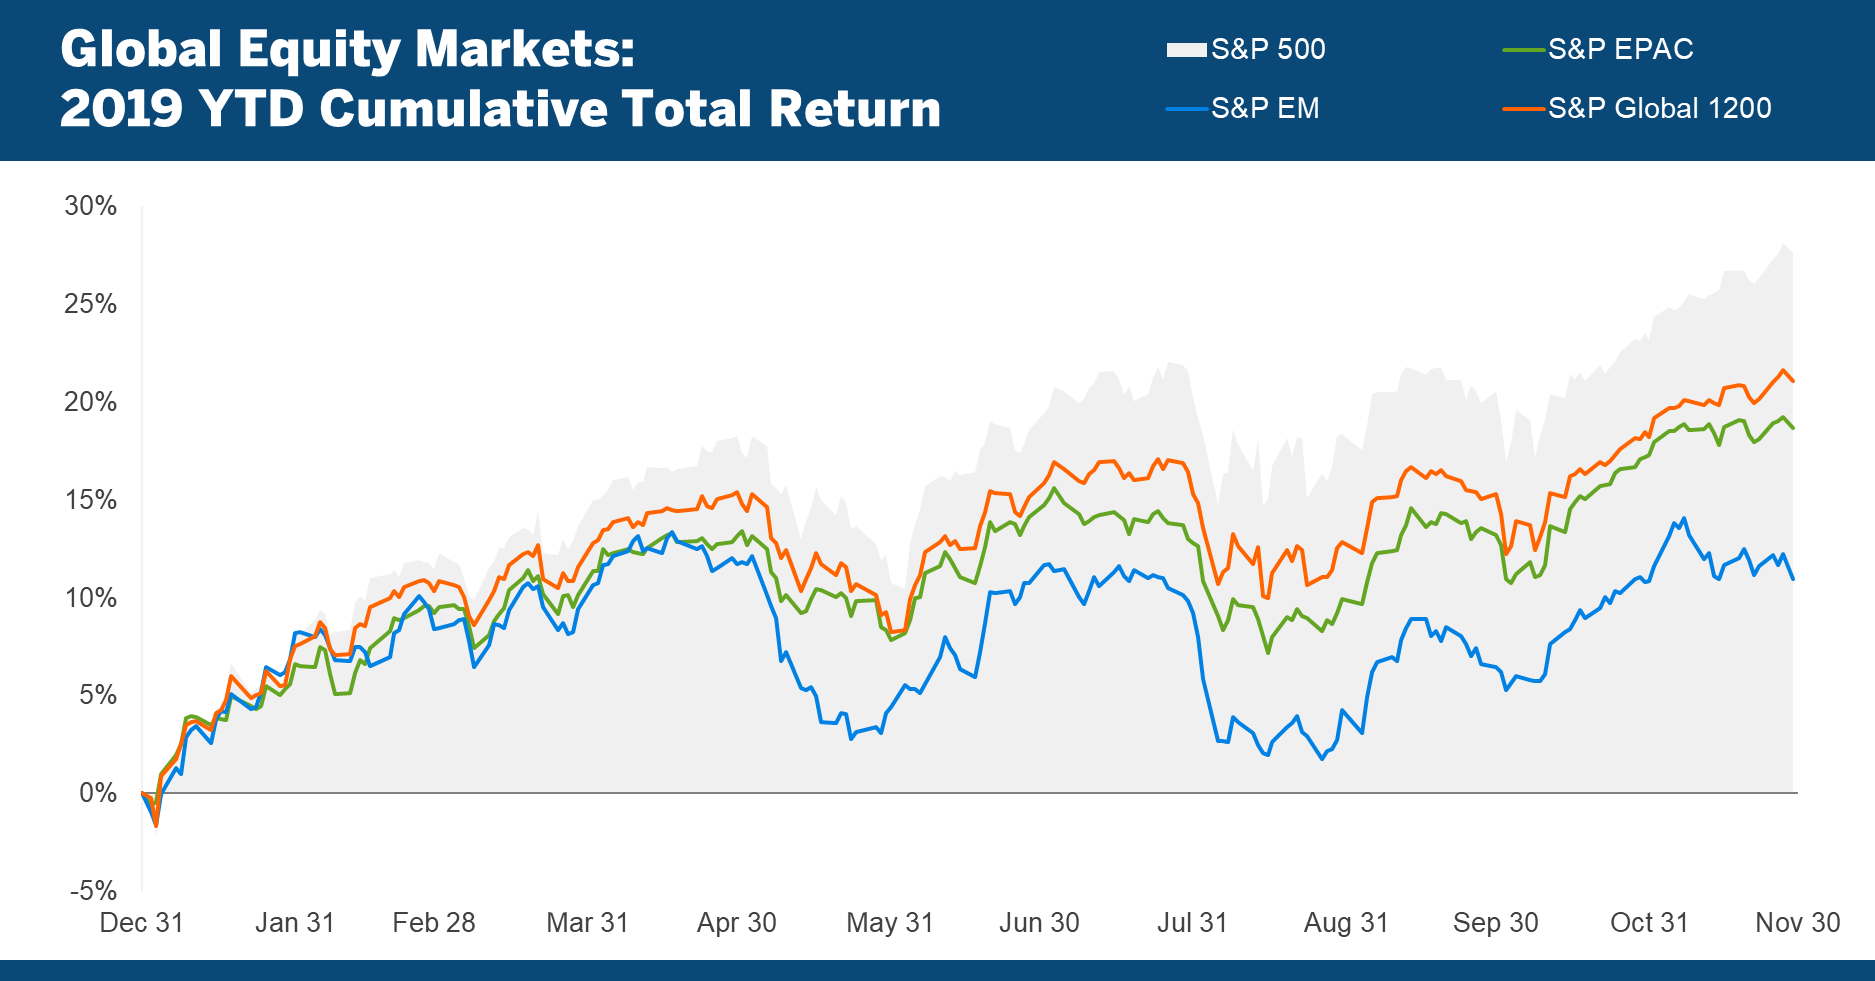
From its 2018 low on December 24, the S&P Global 1200 Index has generated a total return of 29.3% through the end of November, reaching a new all-time high on November 27.
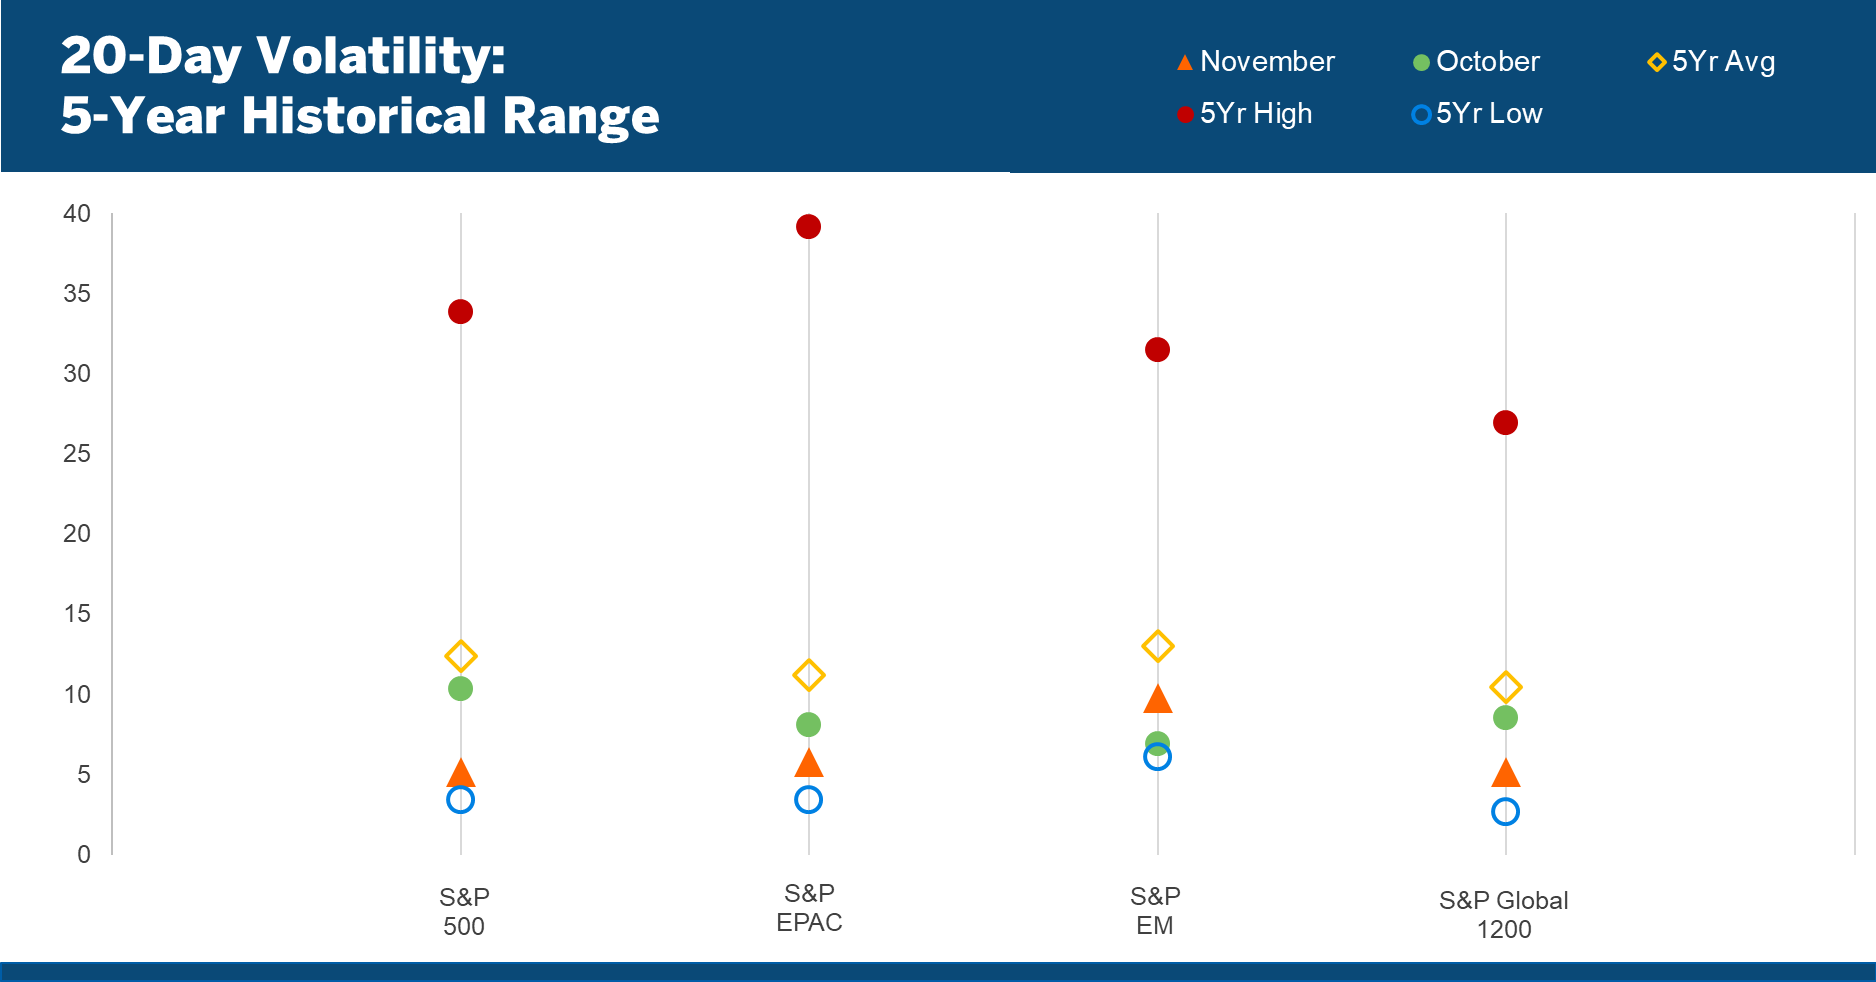
Volatility
Global equity market volatility declined in November, remaining well below its five-year average:
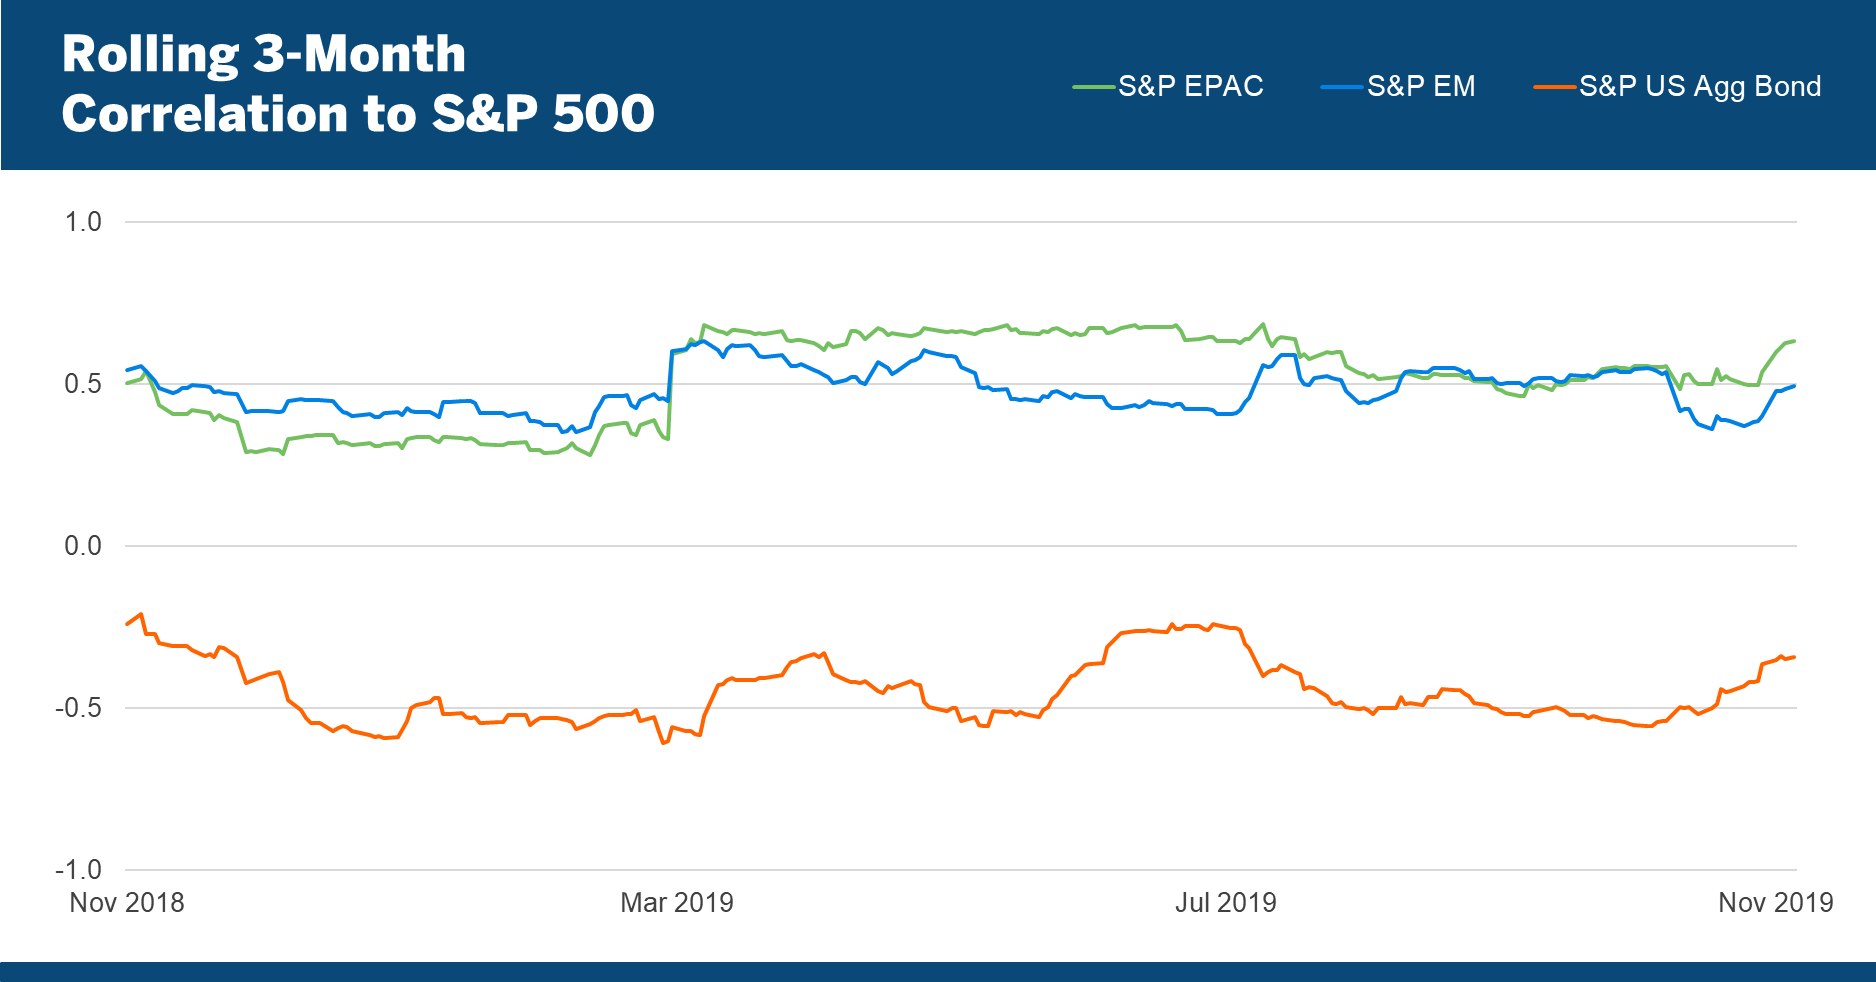
Correlations
The correlation of the S&P 500 to international equity markets and to the US bond market increased in November:
Asset Class Returns
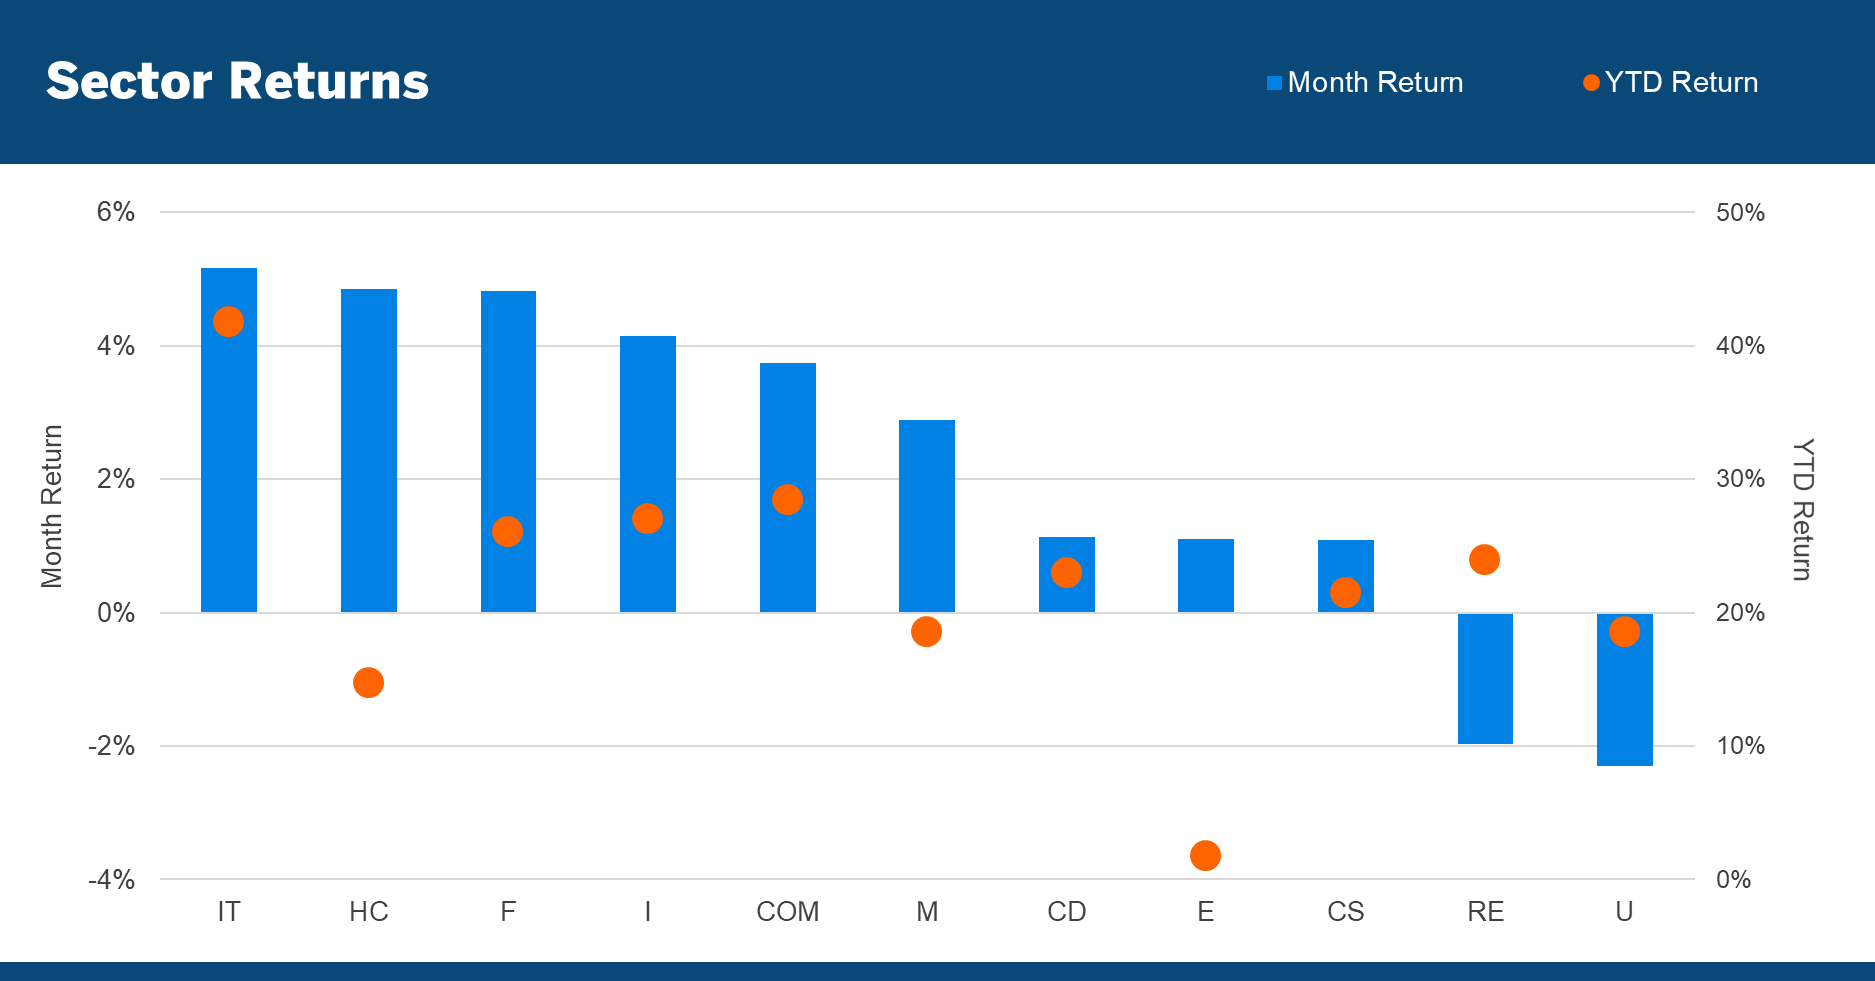
For the third month in a row, equity markets moved higher across all major segments, with U.S. stocks leading the way:
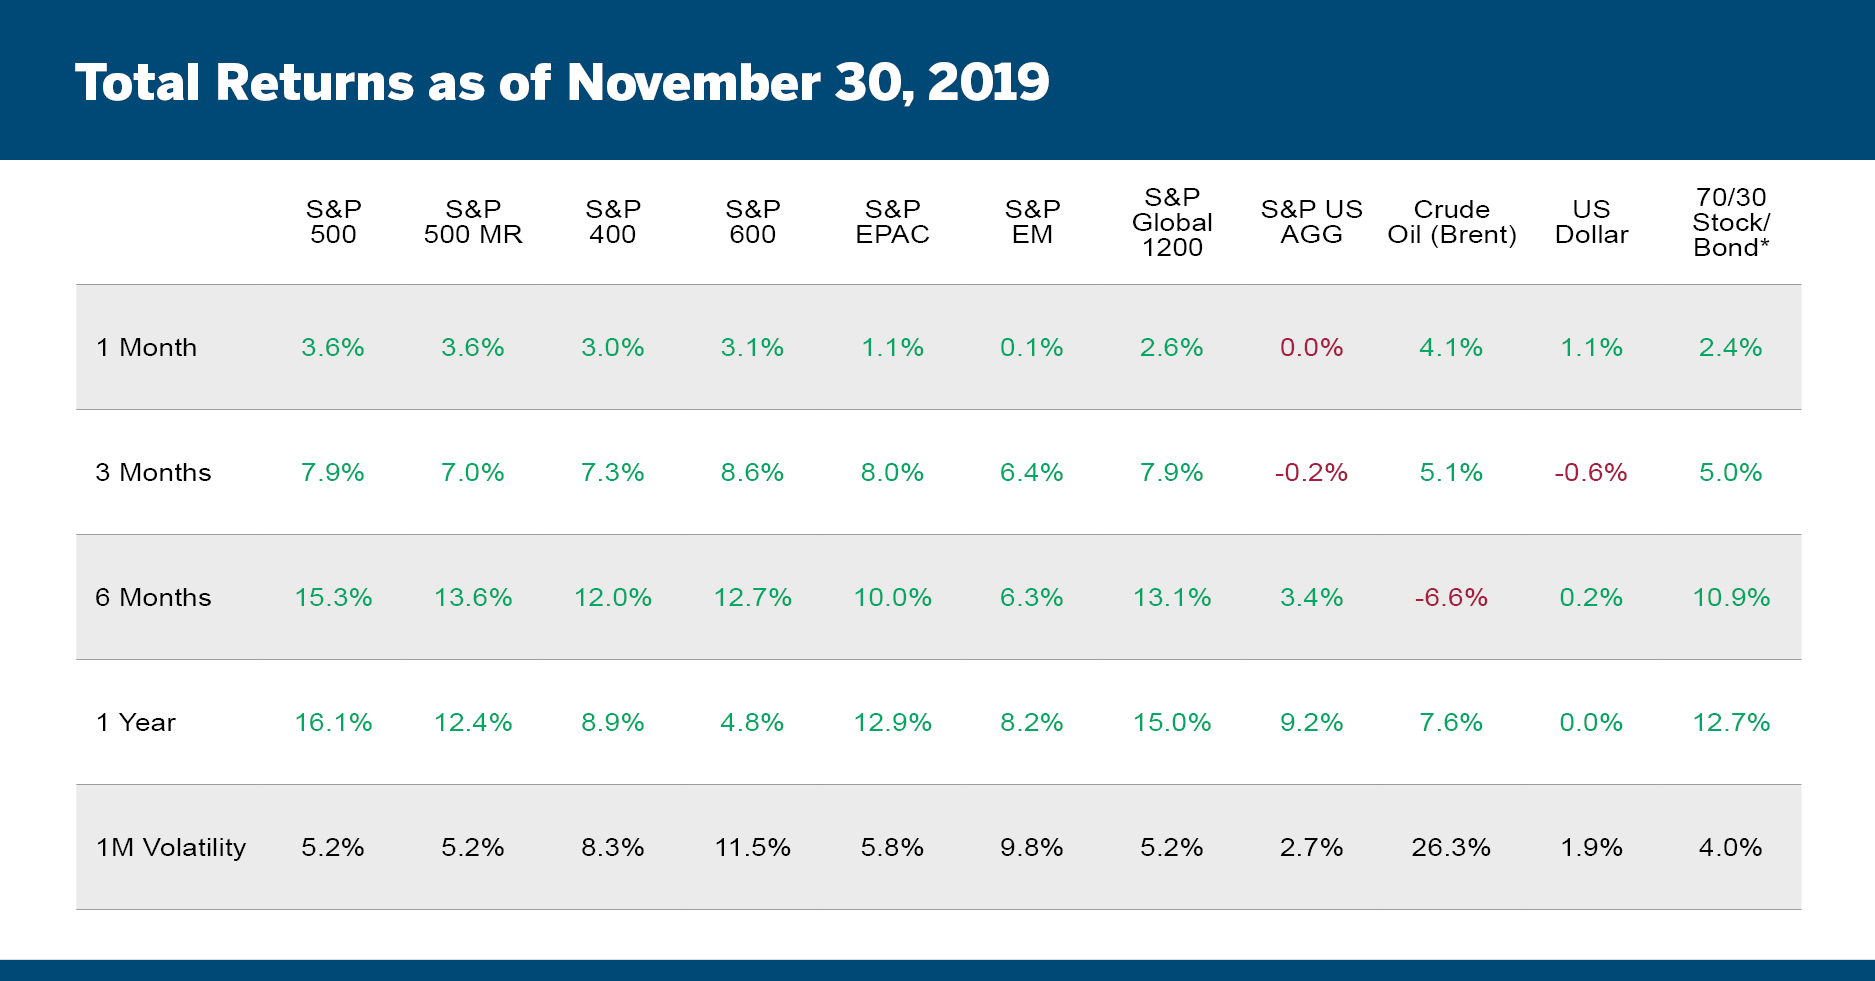
The 24.0% year-to-date return of the S&P Global 1200 ranks third out of the last 30 years. The only two years that had a higher year-to-date return through November were 2009 (coming out of the financial crisis) and 2003 (coming out of the bursting of the tech bubble).
Up 5.2% in November, information technology once again led all sectors, bringing its year-to-date total return to 43.8%, which outpaces the next best-returning sector (communication services) by more than 13 percentage points.
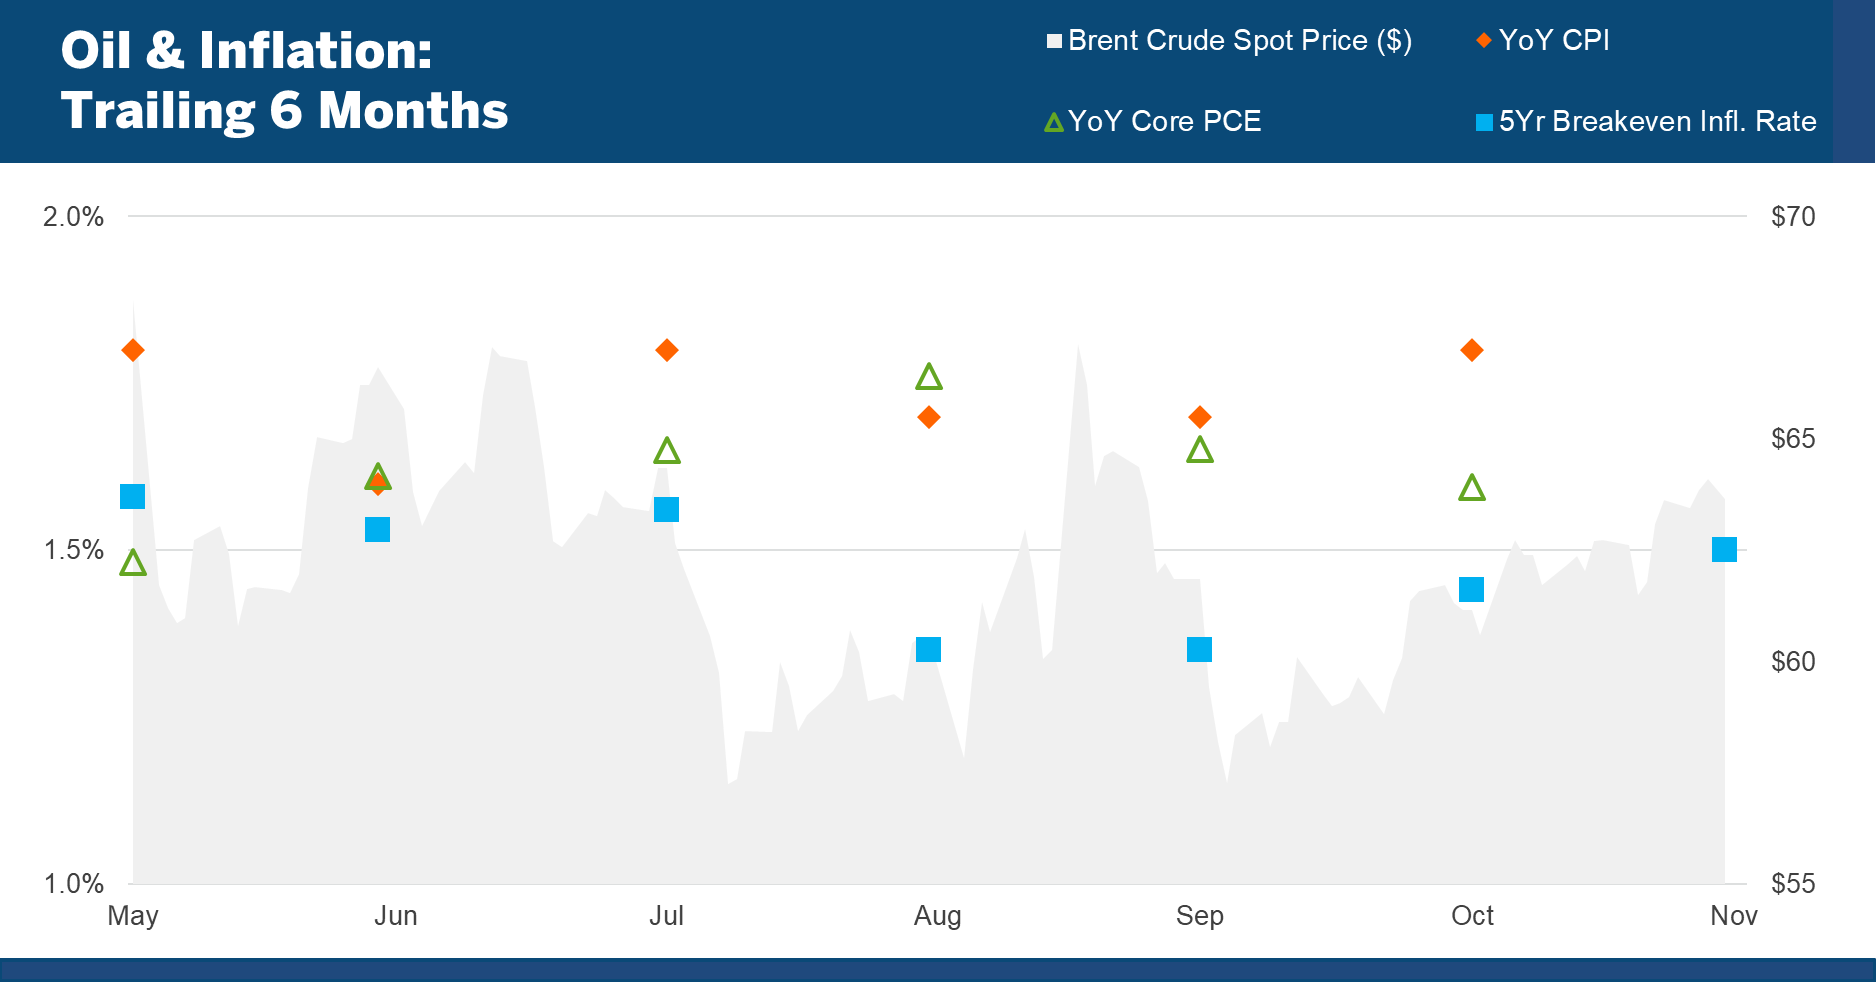
Inflation
The most recent inflation data showed that year-over-year personal consumption expenditure (PCE) edged lower for the second straight month to 1.6% while year-over-year CPI ticked higher to 1.8%. After touching their 2019 low in October, five-year inflation expectations have moved steadily higher, finishing November at 1.50%:
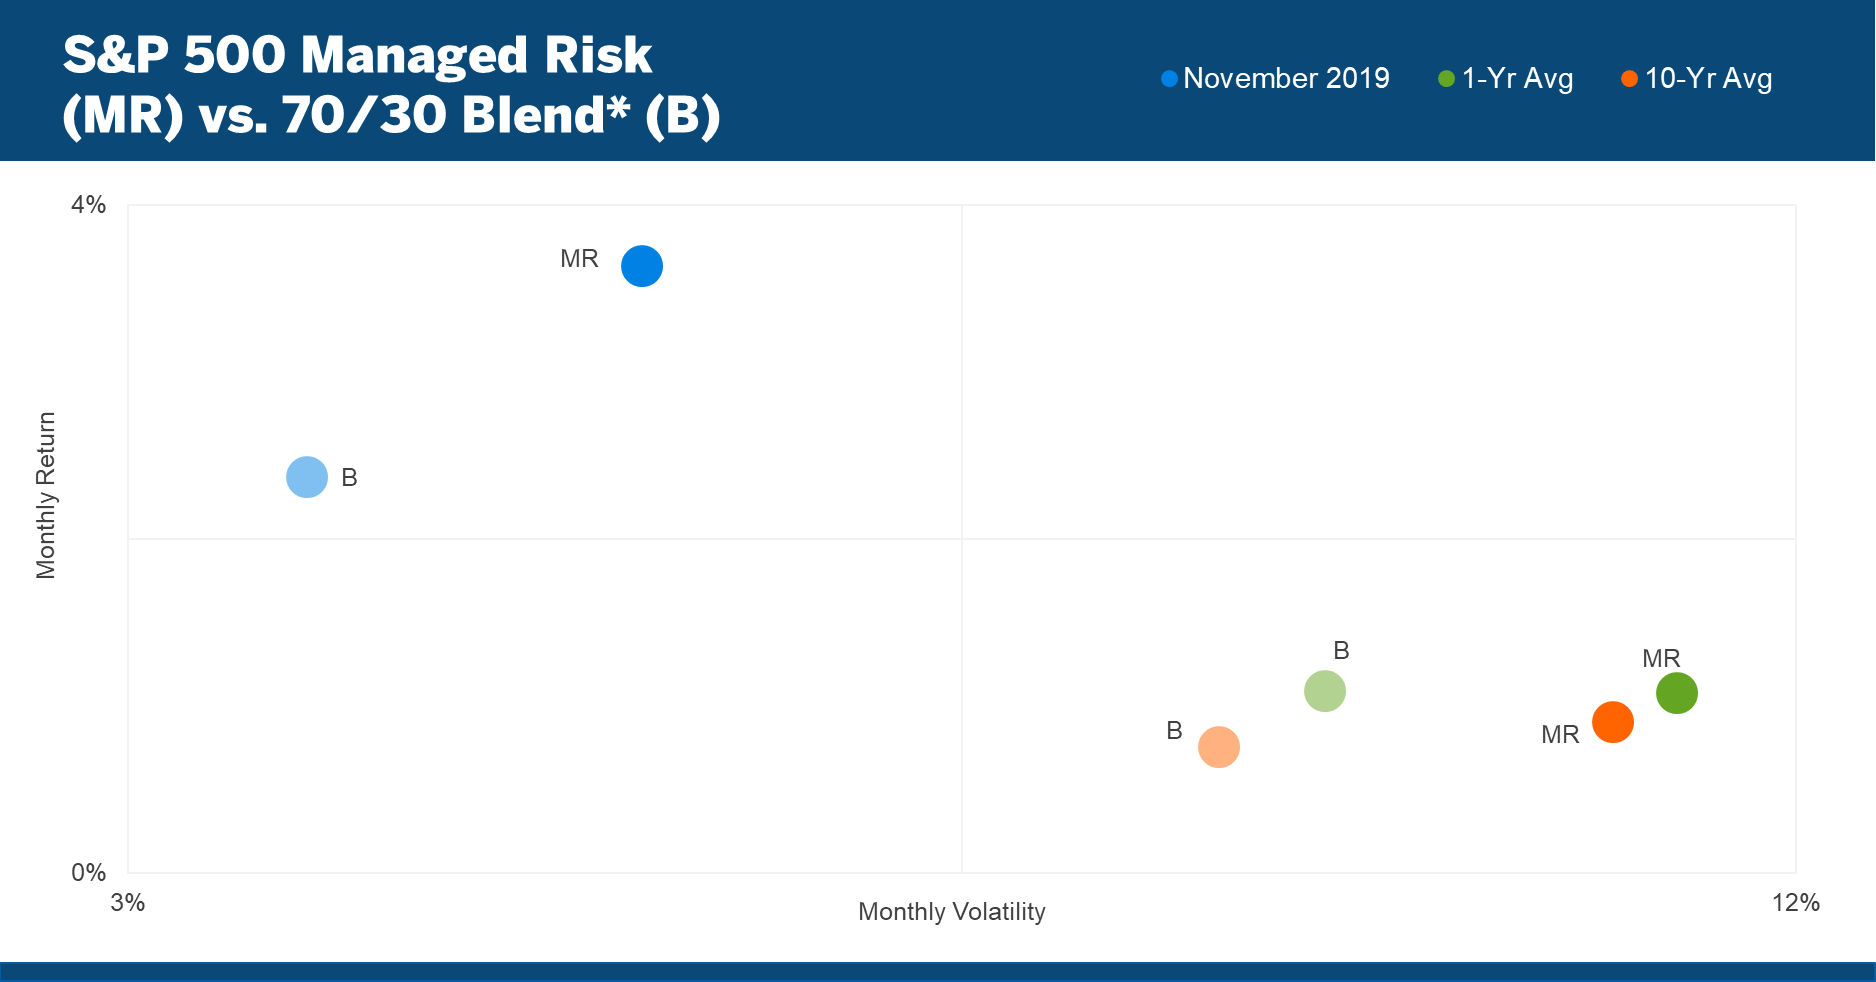
Managed Risk Investing
The volatility of the S&P 500 began November below the 18% volatility threshold of the S&P 500 Managed Risk Index, and remained there for the entire month. Accordingly, the index maintained a 100% equity allocation for the duration, fully participating in the S&P 500’s 3.6% return for the month.
The Managed Risk Index outperformed a 70/30 stock/bond blend by 126 bps in November, with volatility that was higher than the blend, but still low by historical standards. Over the past year, average monthly return of the Managed Risk Index has been identical to that of the 70/30 blend. Over the 10 year period, however, the average monthly return of the MR Index has outpaced that of the blend by an average of 15 bps per month, equal to an annualized excess return of 1.78%:
Equity Market Attribution
The year-to-date total return of the S&P 500 is 27.6%. For an index that has generated such a strong return, the range of returns of its constituents has been remarkable. The top returning constituent is Advanced Micro Devices (AMD), up 112%. The constituent with the lowest return is PG&E Corp (PCG), down 70%.
Of all the companies that have contributed to the S&P 500’s year-to-date total return, just 14% have a negative year-to-date return. With a time-weighted average weight of just 0.08%, their contribution to the index return has been just -0.78%. On the flip side, 20% of the S&P 500’s constituents accounted for 74% of its year-to-date total return.
All 11 sectors have made positive year-to-date return contributions, but none has contributed more than information technology, accounting for 31% of the return with just 21% of the index weight.
Yield Curve: Still Inverted to Fed Funds
The yield curve shifted higher on the month, but remains inverted to the Fed funds rate out to seven years. As of the end of November, the probability of a Fed rate cut in 2020 was 66%.
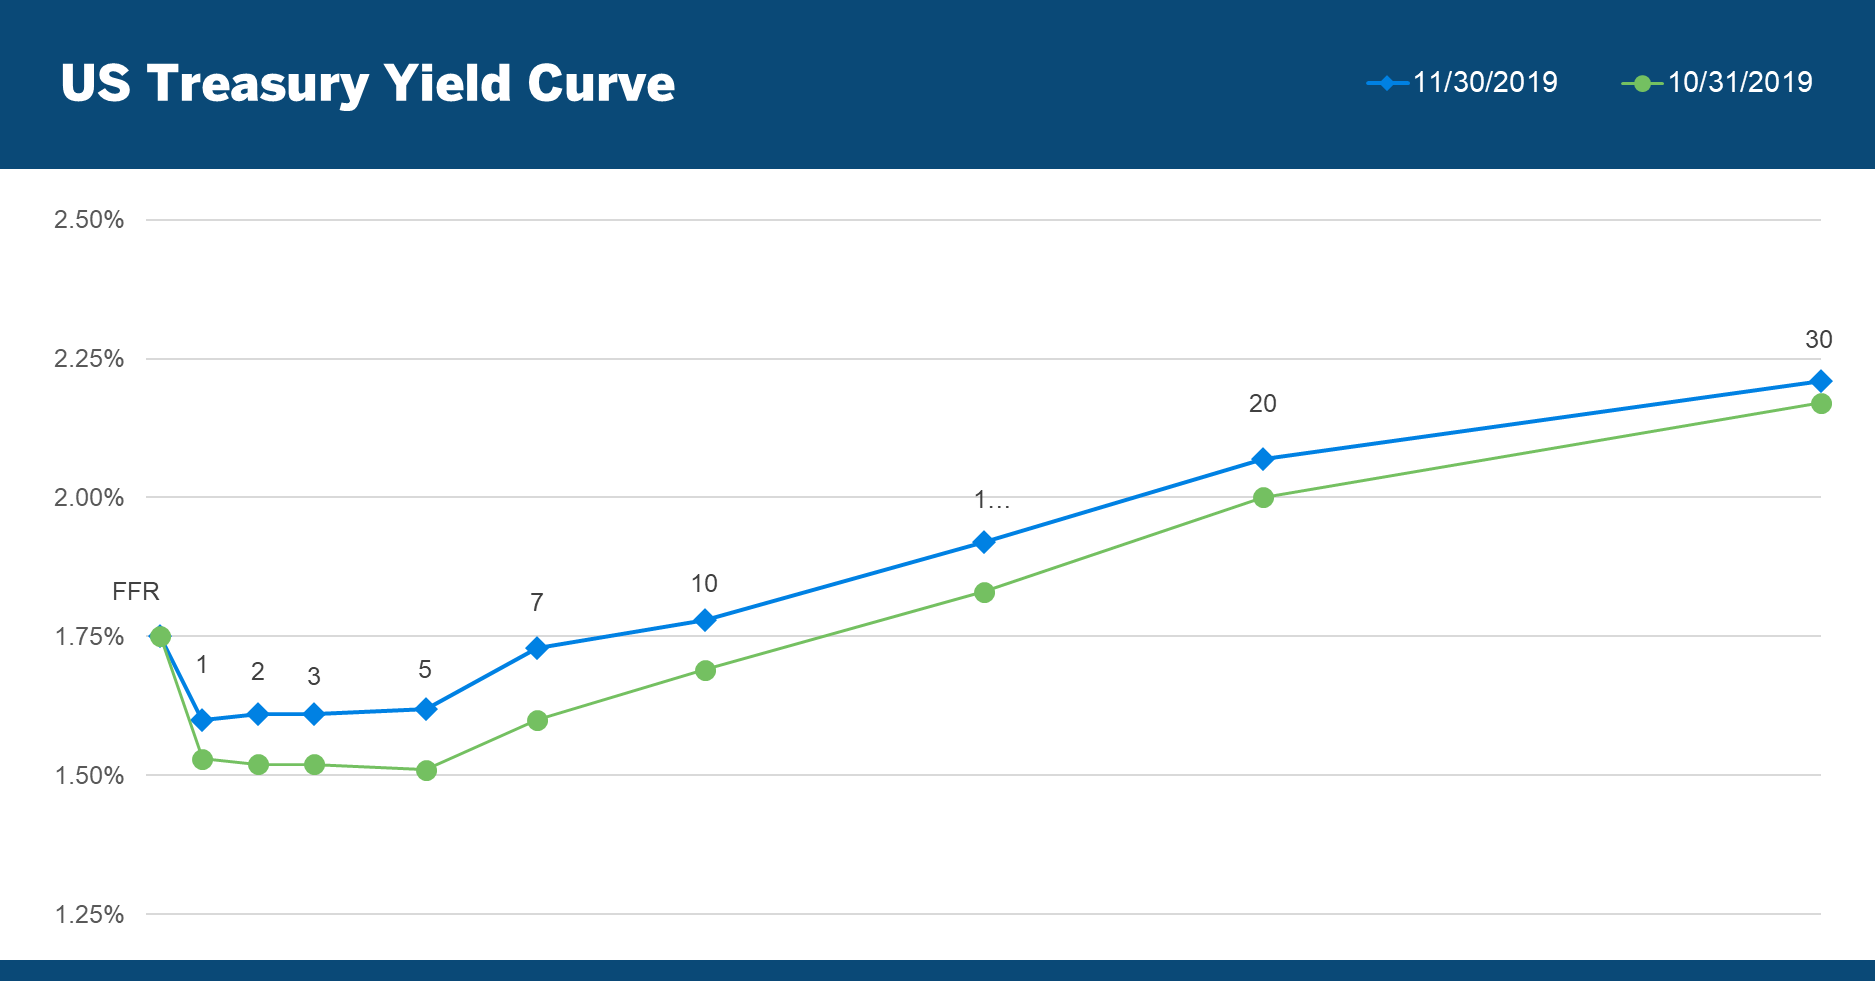
In spite of any aversion the Fed may have to changing rates in an election year, a rate cut seems plausible if only because its current level is incongruent with the rest of the curve. Additionally, persistently low inflation, along with what seems to be a growing expectation of slower economic growth, gives the Fed cover to provide additional accommodation.
As one year draws to a close and another begins, a number of risks that have hovered over equity markets in 2019 continue to loom on the horizon of 2020. Uncertainty surrounding the trade talks with China and the effect of Hong Kong’s unrest on the trade talks, Brexit, decelerating earnings growth, and the 2020 election all represent potential downside risks to the market. To the extent the Fed’s ability to both stimulate growth and act as the market’s put option has been diluted, investors will need to increase their own vigilance in managing portfolio exposure to market risk.
The information, products, or services described or referenced herein are intended to be for informational purposes only. This material is not intended to be a recommendation, offer, solicitation or advertisement to buy or sell any securities, securities related product or service, or investment strategy, nor is it intended to be to be relied upon as a forecast, research or investment advice.
The products or services described or referenced herein may not be suitable or appropriate for the recipient. Many of the products and services described or referenced herein involve significant risks, and the recipient should not make any decision or enter into any transaction unless the recipient has fully understood all such risks and has independently determined that such decisions or transactions are appropriate for the recipient. Investment involves risks. Any discussion of risks contained herein with respect to any product or service should not be considered to be a disclosure of all risks or a complete discussion of the risks involved.
The results shown are historical, for informational purposes only, not reflective of any investment, and do not guarantee future results. Any reference to a market index is included for illustrative purposes only, as it is not possible to directly invest in an index. Indices are unmanaged, hypothetical vehicles that serve as market indicators and do not account for the deduction of management fees or transaction costs generally associated with investable products, which otherwise have the effect of reducing the results of an actual investment portfolio.
The recipient should not construe any of the material contained herein as investment, hedging, trading, legal, regulatory, tax, accounting or other advice. The recipient should not act on any information in this document without consulting its investment, hedging, trading, legal, regulatory, tax, accounting and other advisors. Information herein has been obtained from sources we believe to be reliable but neither Milliman Financial Risk Management LLC (“Milliman FRM”) nor its parents, subsidiaries or affiliates warrant its completeness or accuracy. No responsibility can be accepted for errors of facts obtained from third parties.
The materials in this document represent the opinion of the authors at the time of authorship; they may change, and are not representative of the views of Milliman FRM or its parents, subsidiaries, or affiliates. Milliman FRM does not certify the information, nor does it guarantee the accuracy and completeness of such information. Use of such information is voluntary and should not be relied upon unless an independent review of its accuracy and completeness has been performed. Materials may not be reproduced without the express consent of Milliman FRM. Milliman Financial Risk Management LLC is an SEC-registered investment advisor and subsidiary of Milliman, Inc.
The S&P Managed Risk Index Series is generated and published under agreements between S&P Dow Jones Indices and Milliman Financial Risk Management LLC.