CMS released both January and February 2025 Medicare Advantage (MA) enrollment data on February 13, 2026. This paper was re-issued using February 2026 membership and provides observations of the corresponding market shifts.
As an alternative to traditional fee-for-service (FFS) Medicare, Medicare Advantage (MA) is a government-sponsored program in which benefits are provided to Medicare beneficiaries by private health plans, otherwise known as Medicare Advantage organizations (MAOs). MAOs offer plan designs that cover everything offered by Traditional Medicare plus varying benefits and premiums MA plans are required to offer benefits at least as rich as FFS Medicare-covered benefits but typically also offer benefits not provided under FFS Medicare, which are referred to as supplemental benefits. These can take the form of reduced cost sharing on Medicare-covered benefits, benefits supplemental to FFS (e.g., dental, vision, hearing), or reduced Part B premium buy-downs. MAOs are paid government subsidies to cover traditional Medicare Part A and B services, and can offer these supplemental benefits that are funded by a portion of the savings generated through managing care. Because it is a managed care program, MAOs have features that differ from traditional FFS Medicare, such as contracted provider networks and prior authorizations.
The Milliman MACVAT® is a tool designed to analyze Medicare Advantage plan benefit offerings and is widely used by industry stakeholders to provide a robust and actuarially-grounded assessment of MA competitive positioning, plan designs, and strategy. Each MA plan’s benefit offerings and premium are evaluated to create an associated “value added”—Milliman’s proprietary measurement of plan value. This white paper highlights changes in value added and key benefit trends in the MA market from 2025 to 2026. This discussion focuses on general enrollment plans (i.e., plans that do not target beneficiaries who are dually eligible for both Medicare and Medicaid, have certain chronic conditions, or require an institutional level of care). A separate white paper discussing dual-eligible special needs plans (D-SNPs) can be found here.
Average value added of general enrollment MA plans decreased substantially from 2025 to 2026
Figure 1 shows the average annual growth in value added (total, Part C, and Part D) from 2023 to 2026. It also shows the components of value added, which are benefit value (estimated cost of Part C and Part D benefits to the plan) and member premium (Part B buydown and C plus D premium) from 2023 to 2026.
Figure 1: Average value added, benefit value, and premium PMPM growth/decline for general enrollment MA plans in the last four years

When updating this paper for February 2026 enrollment, due to CMS reporting of complex crosswalks, we adjusted prior year crosswalking scenarios which impacted historical enrollment figures. This resulted in the following observed trends driven by market membership movement, relative to our original analysis:
- Total value added increased approximately $1.20 per member per month (PMPM). This indicates that in aggregate, members shifted to plans that provided higher overall value. This is a trend we typically see each year rolling over from pre-AEP to post-AEP, though the drivers of each AEP remain different.
- Part C benefit value decreased approximately about $1.60 PMPM. This means on average, members enrolled in plans that provided less overall Part C benefit value than pre-AEP. This is consistent with the pre-and post-AEP results we saw from 2024 to 2025 as well. This indicates that Part C benefit value, on average, may not have been as significant of a driver underlying enrollment decisions as other benefit offerings, such as Part D or Part B buydowns, and that other important factors, such as plan network or brand, may have steered enrollment more than Part C benefit richness.
- Relative to pre-AEP, post-AEP members enrolled in plans with about $2.30 PMPM lower Medicare-covered Part C benefit value, while at the same time enrolling in plans with offsetting richer supplemental benefit value by about $2.50 PMPM. This indicates that members continue to be attracted to supplemental benefits as a selling point of plans, and are willing to trade it for less coverage on Medicare-covered benefits when shopping for Medicare plans.
- Relative to pre-AEP, post-AEP members enrolled in plans with a $125 higher medical MOOP, contributing to the observed low Medicare-covered Part C benefit value decrease.
- Part D benefit value was largely flat and increased about $0.13 PMPM. Part D benefit value increased relative to pre-AEP values, in contrast to the Part C benefit value decrease, suggesting that Part D benefit design was a slightly more important of a driver of enrollment decisions compared to Part C benefit value.
- Part B buydowns increased by about $2.20 PMPM. Part B buydowns contributed to the largest change in the growth of total value added, as noted in the second bullet above. Members prioritized enrolling in plans with higher Part B buydowns on average, therefore demonstrating this is a key driver in membership shifts.
- Total Member Premium decreased by about $0.50 PMPM. As we typically see, members prioritized low premiums and migrated toward plans with a lower premium on average, if possible. However, it is still important to point out that in aggregate, the market saw an aggregate premium increase for MA, so members were not able to enroll in plans that in aggregate reduced the average premium charged year over year.
When breaking down 2026 national carrier enrollment changes relative to 2025, a correlation exists amongst net enrollment and value added changes from 2025 to 2026. Figure 2 below summarizes each national carrier’s value added relativity to the 2025 and 2026 market averages (e.g., a relativity above 1.0 indicates the carrier’s membership weighted value added is greater than the market average), along with their net enrollment change observed between those years.
Figure 2: General enrollment market relativites for 2025 and 2026 for national payers, alongside year over year membership increases

The direct comparison of market relativities by year, by major payer, alongside year-over-year membership increases highlights exactly why the MACVAT value added framework is so powerful: it translates value positioning into real enrollment outcomes. While keeping in mind regional differences and enrollment potentially driving these averages, across major competitors, the direction is consistent – when market relativity worsened from 2025 to 2026 (United, CVS, Elevance, Centene), enrollment declined from 4% to 33%; when relativity improved (Humana), enrollment increased by 22%. Outside of CVS, the magnitude is also consistent – the larger value added shifts produced larger membership shifts.
Average total value added continues to erode from 2025 to 2026, with 2026 marking the largest decline in MA. In 2026, total value added across general enrollment MA plans declined by more than 7%, continuing a contraction in benefit value that began in 2025. From 2024 to 2025, total value added had already fallen by nearly $15, driven by nationwide degradations in both Part C and Part D benefits. Because these figures reflect market averages, the declines shown in 2025 and 2026 are driven primarily by benefit reductions among several large national plans and material changes in their footprints; however, regional carriers are also contributing to this trend.
Of note, non-Medicare covered supplemental benefit value decreased by $7 PMPM from 2025 to 2026, an even larger decline relative to the benefit cuts MAOs made in 2024 relative to 2025, which is a significant contributor to the observed total value added erosion. We discuss changes to supplemental benefit values further in this paper.
This is the first time in at least a decade member premiums on general enrollment plans, pre-AEP, have increased in aggregate. The total member (Part C + Part D) premium increased by $1.64 PMPM from 2025 to 2026, deviating from historical patterns of premium decreases year over year. This is due to a combination of $0 plans moving to premium-bearing plans and some $0 plans being eliminated (sometimes in favor of new, $0 offerings from the same carrier). While Figure 1 reflects the totality of the individual general enrollment market, there are 231 fewer $0 MA-PD premium plans in the market in 2026 relative to 2025—a 9.5% decrease. We expect the increased premium change to reduce or even reverse post AEP as members choose $0 plan offerings to replace terminated or premium-increased plans.
This substantial decline in value added in the MA market is driven by leaner MA plan benefit offerings in 2026 paired with increased member (Part C + Part D) premiums:
- All broad benefit categories—inpatient, outpatient, professional, other Medicare-covered, non-Medicare-covered, and prescription drug—had decreased benefit values relative to 2025, with non-Medicare-covered benefits being by far the largest single driver of reduced benefit value to the member.
- A striking number of plan terminations and service area reductions occurred in 2026, requiring nearly 2.7 million non-SNP (special needs plan) beneficiaries to select a new plan for 2026 or revert back to traditional FFS. Because these averages are nationwide enrollment weighted averages, this substantial footprint shift did impact these revised results, as the beneficiaries elected a new MA plan or reverted to FFS Medicare coverage in 2026.
- Part B premium buydowns on average increased each year, with the largest change occurring between 2025 and 2026 and a slightly smaller increase between 2024 and 2025. The average 2026 Part B buydown saw an increase of more than $5 from 2025 to 2026. This is a substantial change post-AEP, indicating members are enrolling in plans with on average, higher Part B buydowns than was available pre-AEP.
Multiple national organizations have discussed continued margin pressures on earnings calls, a common theme in the past two years. The observed degradation of added benefits may be driven by multiyear carrier strategy of preserving margin in MA.
Part D benefit value decreased by just under $4 PMPM from 2025 to 2026 as the market continues to react to Part D program pressures. In 2026, Part D benefit value continued to decrease because of a continuation of leaning out of the Part D benefit design such as increased deductibles and switching from copay to coinsurance benefits on brand tiers. In 2025, many carriers made significant adjustments to Part D benefits in response to programmatic changes—core changes to the Part D benefit structure enacted under the Inflation Reduction Act (IRA). These adjustments primarily included the introduction or expansion of brand drug deductibles and the conversion of brand copayments to coinsurance, collectively driving an estimated $9 reduction in Part D benefit value. In 2026, we observed additional carriers leaning out Part D brand drug benefits, in addition to many carriers continuing to shift more Part D liability to the member through cost-sharing increases.
- Higher brand deductibles and prevalence of coinsurance is likely in response to the “greater of” maximum-out-of-pocket (MOOP) accumulation impact on plan liability.1,2
- Carriers that changed to leaner brand tier benefits in 2025 appeared to continue this strategy into 2026.
- Plans may be limited to offering higher deductible or coinsurance levels on brands due to Enhanced Alternative coverage tests and out-of-pocket cost (OOPC) differential requirements. CMS coverage tests for Enhanced Alternative plans may constrain the extent to which leaner cost sharing can be applied to certain tiers due to the “greater of” MOOP accumulation, and plans must demonstrate a 15% lower Part D OOPC value relative to defined standard coverage.
- For example, Figure 3 below demonstrates a significant shift of copay offerings on brand tiers, particularly non-preferred brands, from pre-IRA to post-IRA with most members in Enhanced Alternative general enrollment MA-PD plans now paying a coinsurance.
- Part D deductibles, on average for MA-PD plans, increased from about $230 in 2025 to about $375 in 2026, but this is not as significant as the $167 increase observed between 2024 and 2025. Many plans with no Part D deductible in 2025 have added deductibles in 2026, resulting in 83% of members with a Part D deductible—a stark contrast from 2024 when only 23% of members had a Part D deductible on their MA-PD plan. Deductible averages and prevalence are shown in Figure 4 below.
Figure 3: Prevalence of members with a copay on general enrollment MA-PD plans with an Enhanced Alternative plan design
| Copay prevalence | 2026 | 2025 | 2024 |
|---|---|---|---|
| Preferred brands | 43% | 72% | 97% |
| Non-preferred brands | 10% | 42% | 88% |
Regardless of the strategic approach MAOs took on Part D benefits, these changes appeared to apply consistently across much of the respective national carrier’s general enrollment plans. We observed many regional carriers making similar changes as well, which could be in response to strategies taken by nationals in 2025.
While the changes from the IRA on average drive out-of-pocket savings to members in 2026, including the $2,100 MOOP and 2026 negotiated Maximum Fair Prices (MFPs), the Part D benefit value considers the additional funding received by plans through the direct subsidy payment, which increased by nearly $60 in 2026. Much of this increase is likely attributed to the pressure on manufacturer rebates created by 2026 MFPs and heightened utilization of brand and specialty drugs (likely attributed to increased benefit richness and many manufacturers changing patient assistance program requirements), which is expected to continue into next year and potentially influence future Part D benefit strategies.
Figure 4: Average Part D deductibles and prevalence for general enrollment MA-PD plans in the last four years

Average Part D deductibles have risen by more than 60% in 2026, and deductible prevalence increased by 22%. Nearly all Enhanced Alternative plans with a deductible only apply the deductible to brand-tiers, meaning most general enrollment beneficiaries do not have a deductible on generic drugs. In fact, we observe the average generic cost sharing (pre-MOOP) decreased relative to 2025, indicating that most Part D benefit enhancements in 2026 are tailored toward generic utilizers. As more carriers are adding and/or increasing brand deductibles, the value of supplemental Part D coverage for brand utilizers on Enhanced Alternative plans relative to basic coverage continues to shrink. The IRA benefit redesign was a significant enhancement to the member, which in turn narrows the bounds in which plans can differentiate Part D benefits from competitors and defined standard coverage relative to the pre-IRA design.
Part C benefit value decreased by about $17 PMPM from 2025 to 2026. While 2025 marked the first year in recent history that plans significantly reduced their medical benefits (approximately $12 PMPM decrease in benefit value relative to 2024), 2026 ushered in substantially larger reductions. This is in reaction to continued rising healthcare trends, regulatory and policy uncertainty, plan exits and market concentration, modifications to risk score models, and other potential headwinds. Between 2025 and 2026, average medical MOOP and deductible levels climbed while supplemental benefits descended, consistent with observed trends between 2024 and 2025. Highly visible supplemental benefits that influence member choice, such as OTC benefits, experienced notable cutbacks in both prevalence and average limits, consistent with observed trends between 2024 and 2025, which we discuss in greater detail below.
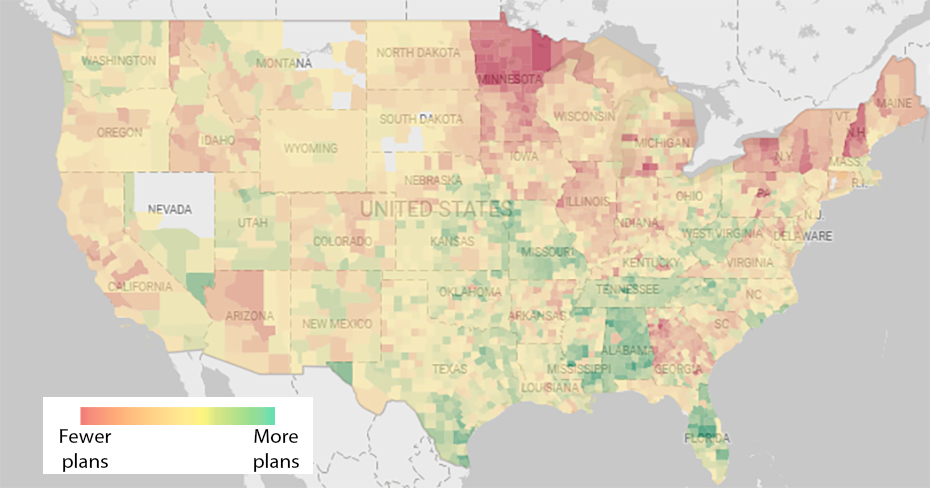
Value added reduction is also influenced by a reduction in net plan count. Based on observed plan count changes, MA-PD terminations and service area reductions appear most severe in the Northeast portion of the country. It is worth noting that net plan increases are primarily driven by a few carriers, while most of the market reduced both plan and county footprints simultaneously. Figures 5a and 5b show significant geographic crossover between plan terminations/service area reductions and benefit value reductions (the major driver of value added reduction as shown in Figure 1). Service areas showing plan count growth alongside benefit compression may offer near-term membership capture opportunities, but discipline will be needed to align growth assumptions with expected 2027 benefit structures and long-term membership projections. Detailed review of value added changes by network type and premium are also high-value activities beyond what is shown in these figures, which encompass the entirety of the non-SNP general enrollment market. How attractive a plan is relative to competitors will continue to be a balancing act for many payers, especially with the MA revenue change proposed in the 2027 Advance Notice.
Figure 5A: Changes in non-SNP plans offered by county from 2025 to 2026*
Source: MACVAT Dashboard.
*Gray represents no plans offered in 2025 or 2026. Excludes MA-Only plans
Figure 5B: Changes in non-SNP benefit value offered by county from 2025 to 2026*

Source: MACVAT Dashboard. Actual benefit value by county is available within the Milliman MACVAT.
*Gray represents no plans offered in 2025 or 2026. Excludes MA-Only plans
General enrollment plans offer leaner Medicare and non-Medicare covered benefits in 2026
This discussion of supplemental benefits focuses on mandatory supplemental benefits and excludes optional supplemental benefits, for which members elect coverage and pay an additional premium.
Figure 6: Average benefit value for Medicare and non-Medicare covered benefits for general enrollment MA plans in the last four years

The benefit value of Medicare-covered and non-Medicare-covered supplemental benefits decreased by approximately $9.50 PMPM and $7 PMPM in 2026, respectively. Figure 6 shows that coverage of non-Medicare-covered benefits, which has historically been the primary way MAOs differentiate and compete for membership, is declining at a rate the market has not seen in at least a decade.
In 2026, non-Medicare-covered benefit values decreased — by $7 PMPM, just slightly more than the decrease observed between 2024 and 2025. This decrease is seen across nearly all supplemental benefit categories in aggregate but is driven primarily by reductions to dental benefits and reduced prevalence and lower limits in OTC benefit card offerings. Decreases are seen across nearly all supplemental benefit categories, but most reductions fall on dental benefits and OTC benefit cards. These benefits have historically been viewed as high value for beneficiaries, yet costly for plans to provide. Both benefit types experienced an average decrease in benefit value by more than $2 PMPM on average.
Medicare-covered benefit value decreased by nearly $10 in 2026 as plans increased MOOPs and medical deductibles, among other service category cost-sharing increases. The decrease in 2026 is about $4 greater than the decrease observed between 2024 and 2025, emphasizing efforts in 2026 to achieve margin goals.
Figure 7: Average medical MOOP limit for general enrollment MA plans in the last four years

The average MOOP increased from approximately $5,100 to $5,440, increasing maximum member cost-sharing liability for medical services by almost 7% relative to 2025 (see Figure 7). A plan’s MOOP will most impact beneficiaries with high utilization of more costly services, such as inpatient or outpatient care, because these beneficiaries are more likely to reach the MOOP during the year. For reference, the average MOOP also increased by 7% between 2024 and 2025.
Figure 8: Average medical deductible level and member prevalence for general enrollment MA plans in the last four years

The average medical deductible substantially increased from $33 in 2025 to $57 in 2026, a nearly 72% increase relative to 2025 and over double the average in 2024 (see Figure 8). While MOOP limits impact beneficiaries with high utilization across more costly services, medical deductibles are applied to any beneficiary with healthcare spend (on the applicable categories), resulting in more “up front” liability to the beneficiary for healthcare spending.
Data sources and methodology
To perform these analyses, we relied on detailed information on MA benefits, premiums, and enrollment as released by CMS. Enrollment used to calculate weighted averages is from February of each year.
The estimated value of the Part C and Part D benefits is evaluated using Milliman’s internal pricing models, including the 2026 Milliman Medicare Advantage Competitive Value Added Tool (Milliman MACVAT), which is available for external license, calibrated to county-specific 2026 FFS costs with consistent medical management and population base assumptions for each county. The 2023 through 2026 benefits within the 2026 MACVAT are evaluated on a consistent basis, without adjustment for year-over-year healthcare trends, such that the only difference between the years presented are the benefits and premiums offered by a plan in each year. This information is used in conjunction with plan-specific benefits, premiums, and benchmark revenue by county released by CMS to determine the value added for each plan.
While the major Part D benefit redesign from the IRA went into effect in 2025 and negotiated MFP prices for 10 selected drugs are in place for 2026, the 2023 through 2024 Part D benefit values presented in this paper are modeled under the 2026 benefit design and cost basis, meaning that the 2023 through 2024 values still reflect the plan’s actual formulary and benefits (e.g., deductibles, cost sharing in standard coverage phase, non-Part D drug coverage) but excludes enhanced gap coverage, assumes the member has a $2,100 MOOP in each year, and 2026 MFPs are in place. This approach allows for a more apples-to-apples comparison of Part D benefit changes year over year and does not credit or discredit plans for inherent benefit changes that are mandatory (e.g., the removal of the coverage gap phase in 2025 does not influence the 2024 to 2025 benefit value changes for plans with enhanced gap coverage in 2024).
This analysis excludes EGWP, SNP, PDP, MSA, MMP, PACE, Part B-only, and cost plans. We excluded all U.S. territories from these results.
The year 2027 could usher in further changes as margin pressures continue
Our industry analysis last year3 correctly anticipated that 2026 would mark another year of benefit changes and MAOs leveraging benefit designs to address market headwinds. Many national carriers have discussed margin pressures on earnings calls and we expect them to again provide early signals as to emerging 2026 performance and 2027 strategies. While we do not expect all carriers in the market to take conservative margin strategies with peeled-back benefits, it is common for MAOs to implement multiyear strategies that tend to focus either on margin or membership, and which has primarily been margin-focused the past two years.
The year 2027 presents both challenges and opportunities to MAOs as new and continued impacts to the entire MA market are looming, including the proposed BALANCE demonstration model, 2027 MFPs, elevated specialty and brand drug utilization trends, star rating methodology changes, changes in member buying habits and shopping preferences, and market reactions to competitor strategies in 2026, just to name a few.
It is essential for MAOs and other healthcare stakeholders to understand local market implications of the anticipated market changes noted above on general enrollment competitor benefit designs. Healthcare stakeholders who understand these changes in relation to their own strategic objectives will be best-equipped to minimize revenue reductions compared to competitors and mitigate risks from industry headwinds. The Milliman MACVAT value added metric, with its underlying methodology and data, provides the financial clarity that healthcare executives need to develop rational strategic benefit designs while addressing market pressures head on.
MACVAT’s value added metric is not just a scoring exercise – it behaves like an early indicator of member response, showing that even modest shifts in value competitiveness can drive meaningful market-share movement. That predictive connection gives those who use the MACVAT a practical, data-backed way to prioritize benefit investments where they are most likely to produce growth (or decline) and avoid design changes that risk enrollment erosion (or invite them).
Caveats, limitations, and qualifications
The information in this paper is intended to describe changes and trends in the Medicare general enrollment market. It may not be appropriate, and should not be used, for other purposes.
We relied on publicly available enrollment and premium data from CMS and the Milliman MACVAT to support the data presented in this paper. If this information is incomplete or inaccurate, our observations and comments may not be appropriate. We reviewed the data for reasonability but did not audit the data.
Milliman has developed certain models to estimate the values included in this paper. The intent of the models was to estimate the value added of services above traditional Medicare for 2026 MA-PD plans, as well as to summarize all benefits offered in the MA-PD market from 2023 through 2026. Milliman has reviewed the models, including their inputs, calculations, and outputs, for consistency, reasonableness, and appropriateness to the intended purpose and in compliance with generally accepted actuarial practice and relevant Actuarial Standards of Practice (ASOP).
Jordan Cates, Julia Friedman, and Ivan Yen are members of the American Academy of Actuaries and meet the qualification standards of the American Academy of Actuaries to render the actuarial opinion contained herein.
1 Karcher, J., Magnusson, J., & Robb, M. (August 27, 2024). Out of whose pocket? Many beneficiaries will spend less than expected to reach the IRA's new $2,000 out-of-pocket spending limit. Milliman. Retrieved February 6, 2026, from https://www.milliman.com/en/insight/out-of-whose-pocket-inflation-reduction-act.
2 Feller, M., Gill, M., & Pierce, K. (October 2, 2025). MOOP there it is: In 2025, Part D beneficiaries are spending $1,200 on average to satisfy the $2,000 out-of-pocket maximum. Milliman. Retrieved February 6, 2026, from https://www.milliman.com/en/insight/moop-2025-part-d-beneficiaries-spending.
3 Friedman, J., Cates, J., & Phillips, E. (April 11, 2025). State of the 2025 Medicare Advantage industry: General enrollment plan valuation and selected benefit offerings. Milliman. Retrieved February 6, 2026, from https://www.milliman.com/en/insight/medicare-advantage-general-enrollment-2025-update.